
Multiple forces in supply chain management have conspired to make it a more challenging and exciting field than ever. There’s customer demand to take care of, investments in technology, accountability to shareholders, and the relentless quest to drive costs down and productivity up.
One thing that makes a great supply chain manager is the ability to take a holistic view of any situation and arrive at a course of action. But these days, even the best supply chain managers don’t need to go it alone.
Thanks to data visualization — or “data viz” — even a wildly complicated supply chain operation can achieve loftier heights of transparency, minimize risk in new ways, achieve better harmony with customer and market demands and, in general, build a better operation. It turns out, all it took was a little visibility.
What Is Data Visualization Technology?
Data visualization requires a buy-in — not only of technology and software, but also of personnel who know how to use and make the most of it. You’ll more than likely find yourself shopping for a SaaS vendor with a software solution that’s tailored, or tailorable, to your industry and operation.
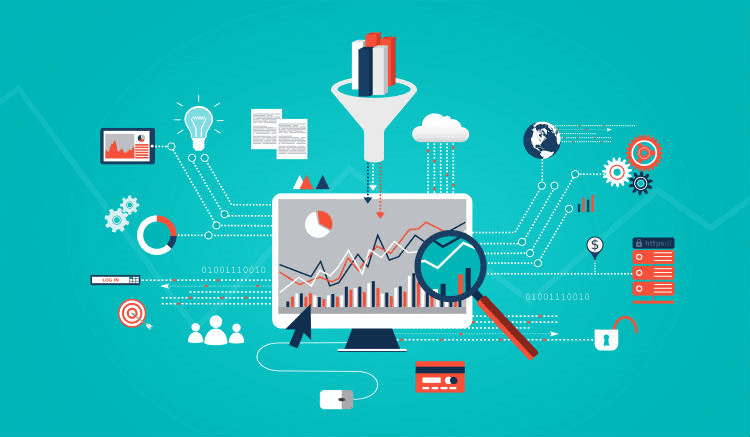
Broadly, data viz is a graphically organized, user-friendly way to present complex operational data. Remember the revolution the graphical user interface brought to the world of personal computers? Data visualization is a similar revolution in data accessibility and mobility.
Think about an operations manager taking in data via a series of spreadsheets. Then, think of presenting that same data through infographics, bar graphs and pie charts, for example. Imagine making these readouts customizable and reflowable so you can study several variables at once.
Data visualization applied to supply chain management is a way for you to look into your operations from one end to the other. There are implications for every step in running a supply chain, including customer service interactions, sales and demand forecasts, financial information, marketing results and ROI figures, and much more.
Practical Ways Data Viz Can Lower Costs, Increase Flexibility and Promote Growth
You’re probably asking: Can data viz, or DV, help me run my supply chain run more smoothly? A couple of practical examples will probably convince you. The three main pillars to consider are lower operational costs, increased organizational flexibility and faster and more sustained growth.
1. DV Lowers Costs
From an employee’s perspective, the ability to receive complex operational data in an easily digestible format means a more forgiving learning curve and a shorter and more affordable on-boarding process for the employer. Having access to real-time data “in the field” or “on the floor” makes it easy to track progress toward benchmarks and register improvement over time.
Reducing the number of requests you make to your IT department, or even the size of your IT department, is another observed cost-related benefit of using a data visualization package. In fact, the right software can greatly reduce the time it takes for your teams, as well as the third parties you rely on, to exchange information. And a faster flow of information means more uptime and steadier productivity.
2. DV Increases Organizational Flexibility
Making smarter business decisions isn’t something that happens spontaneously. Among other things, it requires your data to be mobile and always up-to-date, even with changing conditions. Cloud technology has made managers and the data they need more mobile than ever. By 2020, experts predict 80 percent of “interactions” in the global supply chain will happen over the cloud.
Every company now has the means to collect reams of data about their internal processes, their clients, their vendors and their customers. But a vast dataset is useless without the means to digest and then share it. Engaging in data visualization helps each of the many parties in the average supply chain make sense of large quantities of data, and then break it down into smaller sets that are relevant to one team or process at a time.
From there, a cloud commerce system can help keep managers, warehouses, trucking companies, equipment vendors, material handlers and more on the same page and working from the same sets of data, facilitated by a shared cloud system with appropriate permissions and credentials for each partner.
In the future, things will go a step further when blockchain technologies further supplant the cloud and make the sharing of data and the movement of money and resources transparent and accountable, even without the exchange of other sensitive information. You might hear people call this type of public register “trustless” — which is an extremely unfortunate misnomer.
3. DV Promotes Company Growth
One of the most useful ancillary benefits of engaging in data visualization is better organizational communication. Managers overseeing supply chains can use DV to trawl through useful data and draw conclusions more quickly. But that doesn’t just make their lives easier — it also facilitates better communication all up and down the organization, from shop or warehouse floor to the boardroom. Maybe not real time, but something close to it.
In the future, you can expect data visualization to go a step further with the introduction of AI into more and more processes, too. Companies that rely on supply chains could see themselves positioned for growth and competitiveness by using machine learning to draw meaningful predictions from the data being gathered along the supply chain and then deliver it using a DV interface.
Why is this relevant? Because the growth of any company depends on how well it balances consumer demand with the use of its resources. Achieving total visibility in your organization, and powering predictive algorithms with machine learning, will make your company more resilient and help you plan for a changing global economy. That includes unpredictable access to — and cost of — raw materials, as well as increased scrutiny over companies’ uses of natural resources and the soundness of their business practices.
Data Viz Is the Future of Supply Chain Management
In other words, among other things, DV can help keep us honest when we say our companies are green and our operations are running lean.
It also facilitates close to real-time communication between management and employees on operations floors or out on the roads making deliveries. And it helps companies react more quickly to outside events. But it also peels away some of the layers of mystery and helps employees and managers alike find possible cost savings, and better ways of doing things, in places they didn’t know to look.