
MongoDB is a NoSQL database. Along with optional schema, this cross-platform database uses JSON-like documents for data storage. MongoDB was created for automatic scaling, high performance for high persistence data use cases, and high availability. If you need a massive scale or rapid prototyping for documented oriented use cases then MongoDB is an ideal pick for you.
Of course, the massive scale will bring in massive traffic too. And the bigger the size of the data, the more challenges you have to face running your app or with its infrastructure. Therefore, you need a tool that can monitor the entire database for potential issues and when one arises, you are notified immediately. Hence, in this article, we are going to look at some of the best MongoDB monitoring tools that can aid you in running database instances and clusters without any kind of surprises.
Best MongoDB monitoring tools
Datadog
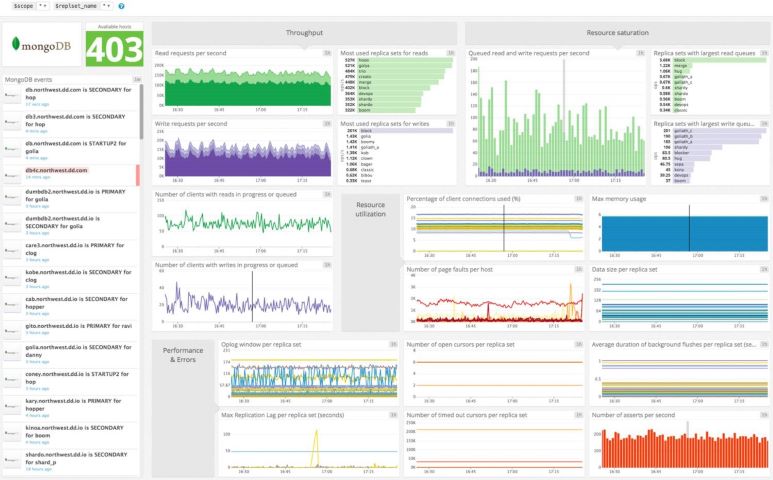
Datadog is a comprehensive SaaS monitoring solution with capabilities of monitoring MongoDB databases. To get insights into what’s happening in the database, Datadog provides all the necessary key metrics. This tool helps you focus on crucial information related to MongoDB clusters and instances as well as avoid alert fatigue. Because the tool comes with features like alerting and anomaly detection that are empowered by powerful ML algorithms. Moreover, you can also obtain code-level insights with a simple root cause analysis to enhance troubleshooting.
Pros:
- The default agen package enables unique MongoDB performance monitoring.
- Provide support for ECS, Kubernetes, Docker, virtual machines, and bare metals.
- If the MongoDB environment needs to be expanded then it shall be done so automatically by auto-discovery services.
- You can get an in-depth view of the environment in which your MongoDB instances are running.
- Offers support for metrics and logs to make sure that MongoDB requests, instances as well as data sources are completely visible.
Cons:
- Its pre-built dashboard has limited metrics so it does not tell you the full story, i.e. you don’t get full visibility. So, you might have to work on tweaking it to gain full visibility into MongoDB clusters and instances.
Pricing
Depending on what kind of solution you need, the prices of the tool vary. If you need basic MongoDB monitoring then you can opt for an app performance monitoring plan that starts at $31/host per month if billed annually or $36/host per month if billed monthly.
Site24x7
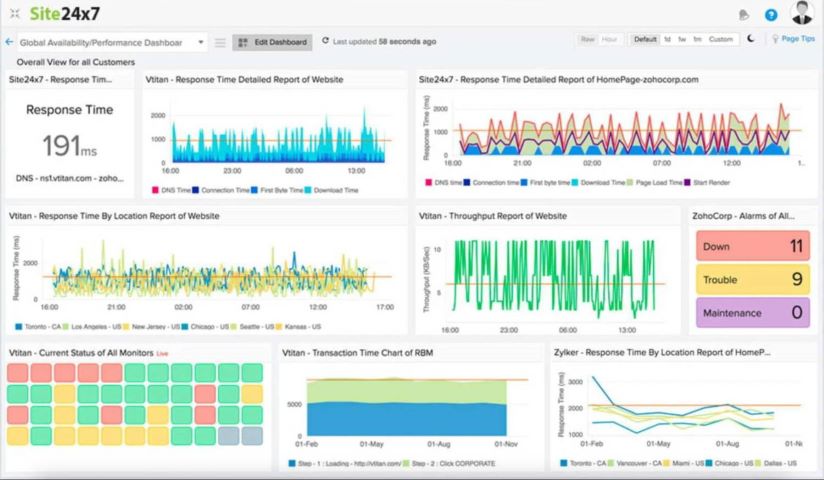
Looking for a tool that offers essential metrics to monitor the health and status of your MongoDB instances and clusters? Site24*7 is your answer. Moreover, this tool is not limited to MongoDB, it can monitor over 50 different technologies that run in your infrastructure like Redis, Elasticsearch, MySQL, and more. Site24*7 gives more narrow and better alerts as its alerting engine is equipped with an advanced rules system. This not only helps you gain insights into your MongoDB instances’ performance issues in real-time but also in limiting your alert fatigue.
Pros:
- Total open cursors, heap usage, available and current connections, and more out-of-the-box support are provided for MongoDB metrics
- Cross-platform MongoDB monitoring system
- Dashboards are easy to build and come with a custom view for every component of the infrastructure.
- Quick and easy agent installation.
Cons:
- Provides server monitoring support to only limited technologies
- The APM plan isn’t enough to get full visibility of the MongoDB database
Pricing
Site24*7 plans vary as per your requirements. The APM plan price starts from 35 euro per month with up to 3 apps, up to 500 MB of logs, and 40 servers. But if you are looking for infrastructure monitoring then its annual plan includes 9 euros per month with 100k page views for a single site, 500 MB of logs, and 10 servers.
ManageEngine Applications Manager
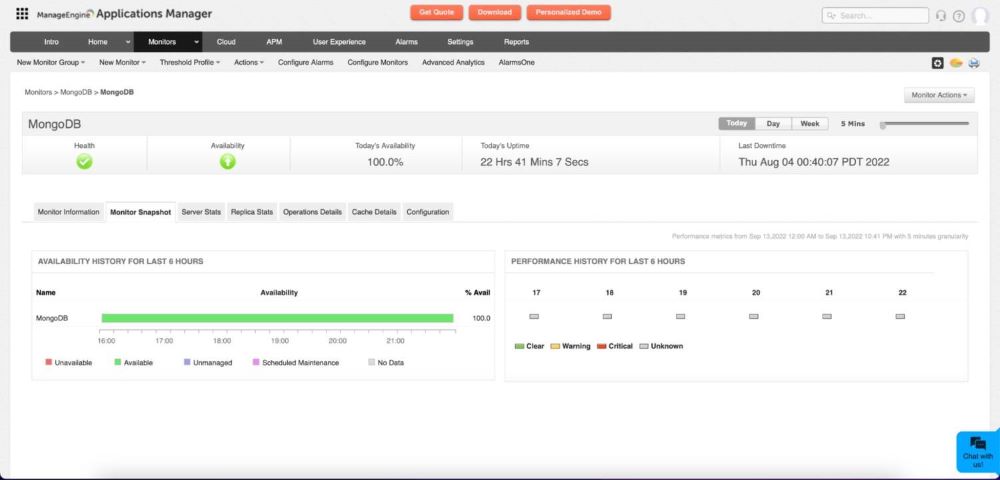
If you want a performance monitoring service that can monitor MongoDB databases regardless of the environment of operation then ManageEngine Applications Manager is your tool. It is a unified app performance monitoring tool that supports all types of infrastructure architectures. Tracking your MongoDB database, analyzing it, and detecting performance trends become easy with the notification support and a flexible alerting engine offered by this tool.
Pros:
- The dashboard is easily customized for better visibility depending on your monitoring requirements
- Supports the monitoring metrics in all types of environments including bare metal, OpenStack, Google Cloud Platform, Microsoft, Azure, and Amazon Web services.
- To obtain quick insights into potential problems with the database and its app, this tool offers Hotspot detection.
Cons:
- Heavy interface
- Does not support metrics and logs correlation
Pricing
There is a free tier if your need is up to 5 monitors. But if you need more then you have to pick one of the two pricing tiers; professional and enterprise. Their prices will depend on various factors such as the number of users of your platform, the number of monitors you need, and other monitoring requirements.
SolarWinds Database Performance Monitor
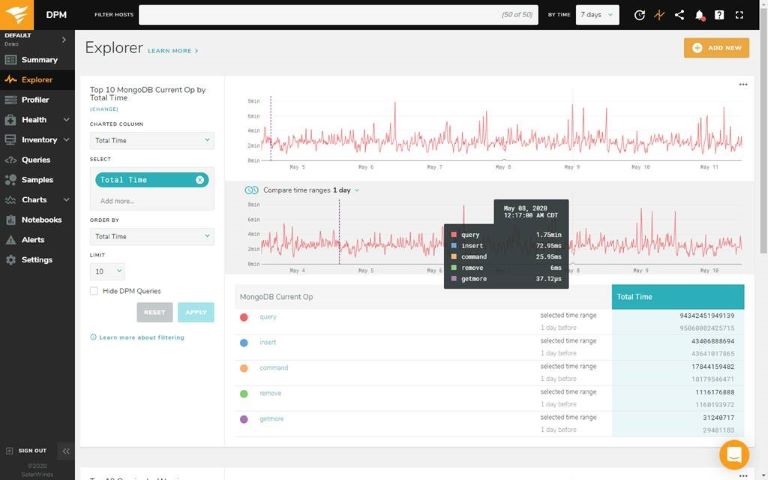
If your cross-functional teams need some help in optimizing and monitoring different kinds of databases then SolarWinds is the perfect monitoring tool for you. Its historical metrics provide real-time observability for the MongoDB database and its environment. You get to understand the current state of the database as well as identify the potential performance bottlenecks. In addition to monitoring, SolarWinds also helps with database configuration that leads to optimization opportunities.
Pros:
- Provides support for all essential MongoDB metrics
- To identify security vulnerabilities, it performs security checks and scans along with best security practices.
- Automated profiling analysis
- Can monitor MongoDB database under any environment
Cons:
- Alerting engine is not much flexible
Pricing
No clear information is available about the tool’s prices. But if you want a quote, you can get it from their sales representative or by using an interactive form that is available on their website’s online quote page under the solutions category.
Opsview
If you are looking for an all-in-one monitoring system that covers monitoring for all apps, virtualized, and containerized environments, as well as on-premise infrastructure and cloud platform then OpsView is the right tool for you.
It might pique your interest to know that this tool was created to grow automatically with your infrastructure. This keeps you from worries about your current as well as future architecture. And do not think that OpsView will work with MongoDB metrics only, it has got you covered for more than 200 infrastructure elements.
Pros:
- Compatible with a variety of Nagios plugins
- Supports notification alerts for Twilio, Slack, email, and mobile.
- Clear and easy-to-navigate UI.
- To fulfill your requirements or gain full visibility into network metrics, runtime environments, or MongoDB instances, you can customize the dashboard including its network maps and performance graphs.
- Provides a rich set of integrations for monitoring
Cons:
- Pricing is available on demand.
Pricing
Although the pricing of OpsView is available on demand, the official pricing page states that their cloud version is priced at 9 euros per month per host.
Conclusion
It doesn’t matter if you are working with single or multiple clusters and instances for a complicated or scalable distributed system, you need the right tool that can constantly monitor the performance of the app and the health of the infrastructure. It should also be able to alert you about anomalies in real time. Such a tool should be able to provide a root cause analysis with the help of multiple monitoring metrics logs and traced correlation. Your MongoDB monitoring tools must not only be fast but also user-friendly. Although it should alert you in real time about performance and other issues, it should also shield you from alert fatigue. Hopefully, you can find a ‘tool of your requirements’ after reading this article on the best MongoDB tools considering their pros and cons against your requirements.