
A control chart, which can also be called a Shewhart chart, is a tool for data collection and analysis that is used in business or manufacturing to determine whether a process is in a controlled state statistically.
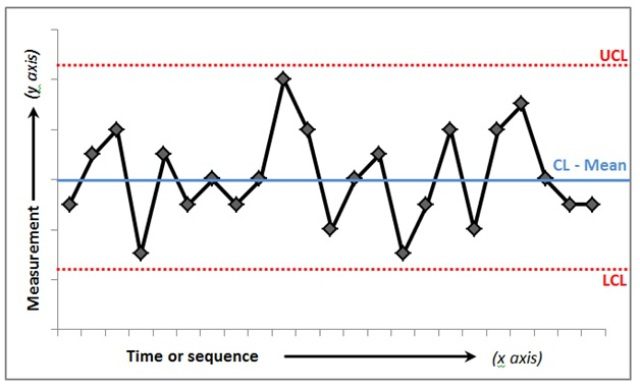
It comes in form of a graph and it is used to study how an activity changes over a period of time. The data on the chart is plotted in a timely order and it typically uses three parameters which are:
- A central line for average
- An upper line that is used for the upper control limit
- A lower line that shows the lower control limit.
These three lines are known from previous historical data. The chart is then used to perform a calculation on this data and it displays:
- The median or average as the center line
- The data variation as compared with the upper and lower limit lines
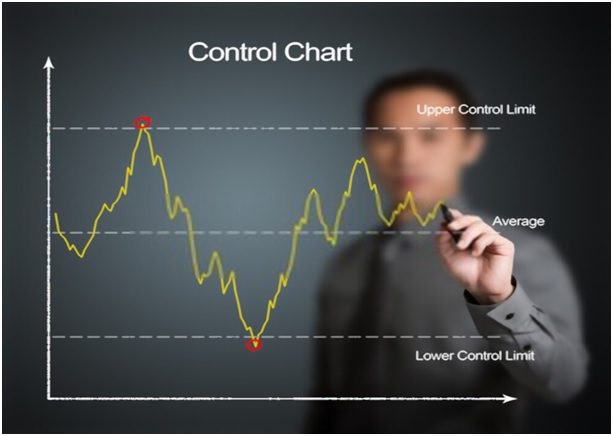
The data derived can be used to make predictions on future performance. When the current data is compared to these lines, you can deduce whether the variation in the process is consistent and stable from the comparison. That is, whether it is in control or unpredictable which means it is out of control.
The purpose of the chart is for setting upper and lower bounds for acceptable performance so that it sounds the alarm when there is a shift in the process. This helps to improve poor performance as well as maintain success depending on what the data shows. You can read about this here.
When Do You Need a Control Chart?
Shewhart charts are considered as one of the seven basic quality tools used in process improvement and it is useful in a variety of industries. It is mostly used in the manufacturing industry but can as well be useful in non-manufacturing industries such as finance, software development, healthcare, human resources, and so on.
It can be used for budgeting, processing invoices, monitoring manufacturing operations and machines, talent retention rate, website operations, etc. Some of the common ways to use it include:
- Predicting the range of expected outcomes for a process.
- Controlling a process by finding and solving issues as they occur.
- Discovering how stable a process is
- Analyzing patterns of variations in a process from special and built-in events and causes.
- To determine whether a project should be used to make fundamental changes to a process or prevent specific problems.
The procedures for implementing control chart improvements are the same regardless of industry and it can include:
- Defining what needs to be measured and controlled
- Identify the system to supply the data
- Choose an appropriate control chart (there are different types)
- Determine the time for the collection and plotting of data
- Get the data, construct the chart and analyze
- Watch out for “out-of-control” signals.
- Carry out any preventative measures based on the information you have.
When an “out-of-control” is discovered, it should be marked and the cause should be investigated. All these should be documented; that is, the cause of the issue and how it was corrected.
Choosing a Software
There are software that allow for the automation of Shewhart charts thereby allowing organizations to improve their quality. They are used to monitor the process and when a situation arises where the upper or lower limit is exceeded, the software sends an alert in the form of an email, text or light pole alarm to inform handlers of this abnormality.
Choosing the right software is crucial, it should include relevant information that will give you insight into your processes. A good software will have traits such as:
- Control limits reflecting a shift in process
- Using clear as well as extensive and accurate titles
- Chart annotations
- Identifying out-of-control situations clearly
- Show underlying data
- Show assignable causes but they should not be used during calculations.
You can check out http://www.pqsystems.com to learn about these and many more.
Conclusion
Shewhart charts are good indicators for revealing variations and issues in an organizational process and this helps the organization to improve where necessary.
A control chart software helps to automate this. Before going ahead to choose a software, you should ensure that it has the 7 healthy traits that will not only help improve your process but will as well reflect the new reality and offer powerful feedback.